Unit 1 Videos
Exploring Science

Designing Experiments with the Mythbusters
MythBusters Episode 81: Grenades and Guts
(You must be logged into your school gmail)
Slide #1
Unit 2 Videos
Data Analysis

Graphing Data by Hand
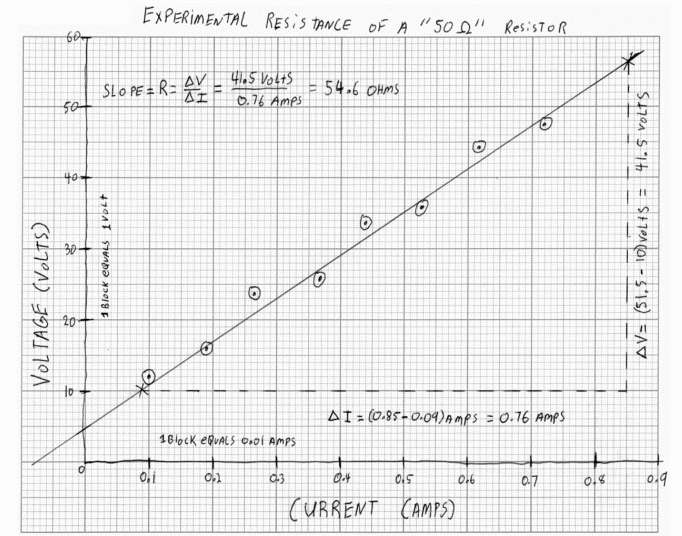
Mr. Andersen (2011 Montana Teacher of the Year and National Teacher of the year Finalist) shows you how to graph data by hand. He explains the required elements of a scatter plot with a best fit line and also shows you how to properly scale and label the axes.
Slide #1

Unit 3 Videos
Measurement

Time To Switch To The Metric System!
Making the switch to the Metric System has been talked about for decades in the US... but nothing's ever come of all that talk. Trace explains why it's so much better and why we should take the metric plunge.
Slide #1
Unit 4 Videos

Density Investigation


Can Density Be Blamed for the Mysterious disappearances in the Bermuda Triangle?
Slide #1
Start your Investigation by watching the FOUR following videos and then complete the google form at the end.

Unit 5 Videos
Unit 6Videos

Unit 7 Videos
Unit 8 Videos

Atomic Structure

The Periodic Table Song
Written, Directed, Produced, Edited and Sung by Mitchell Moffit. Based on the "Can-Can" music, by Offenbach. Can you name ALL of the elements?
Slide #1

Unit 9 Videos
Acids,Bases, and Salts

Acids, Bases, and pH
Paul Andersen explains pH as the power of hydrogen. He explains how increases in the hydronium ion (or hydrogen ion) concentration can lower the pH and create acids. He also explains how the reverse is true.
Slide #1
Force & Motion
(Kennywood)

Universal Gravitation
I'm sure you've all heard about Isaac Newton and that apple that fell on his head and how that was a huge deal to our understanding of gravity. Well... let's talk about that. In this episode of Crash Course Physics, Shini sits down to talk about the realities of the apple story and how Newtonian Gravity is more than a little important.
Slide #1
Unit 10 Videos

Special Video Collections


